Homepage
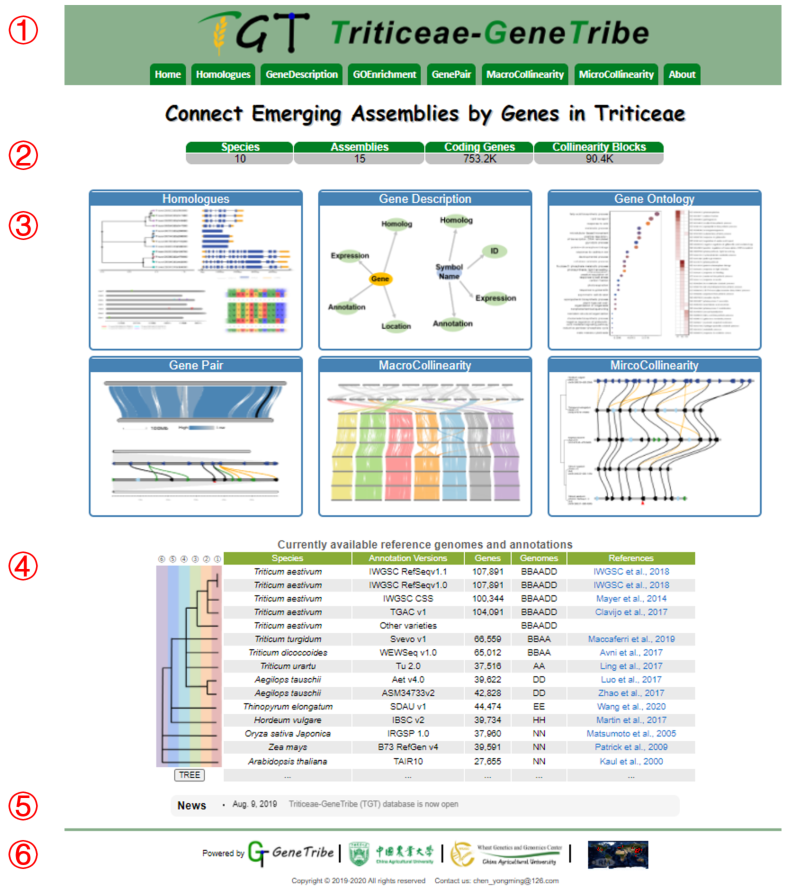
1. The logo and modules in database.
2. Statistical information of database.
3. Descriptions and links of the modules.
4. The tree on the left, coming from GeneTribe, indicates the structure of the assemblies in the database. The table on the right lists species, annotation versions, genes number, genomes, and references.
5. The News shows the update log and the latest status.
6. The footer shows the sponsors and website visit statistics.
Description of Homologous Genes in TGT
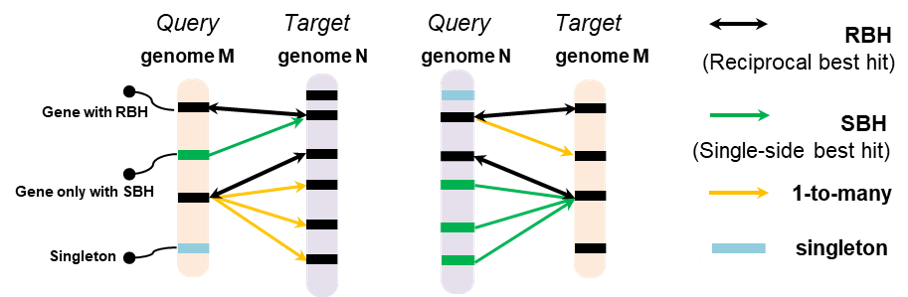
Based on the algorithm of GeneTribe, homologous genes are divided into four types: RBH (Reciprocal Best Hit), SBH (Single-side Best Hit), singleton, and 1-to-many (all putative homologous genes). The description of homologous genes is shown in the figure. The black blocks represent genes. The lines represent homologous relationships.
Definition of the Distance in Collinearity Plot
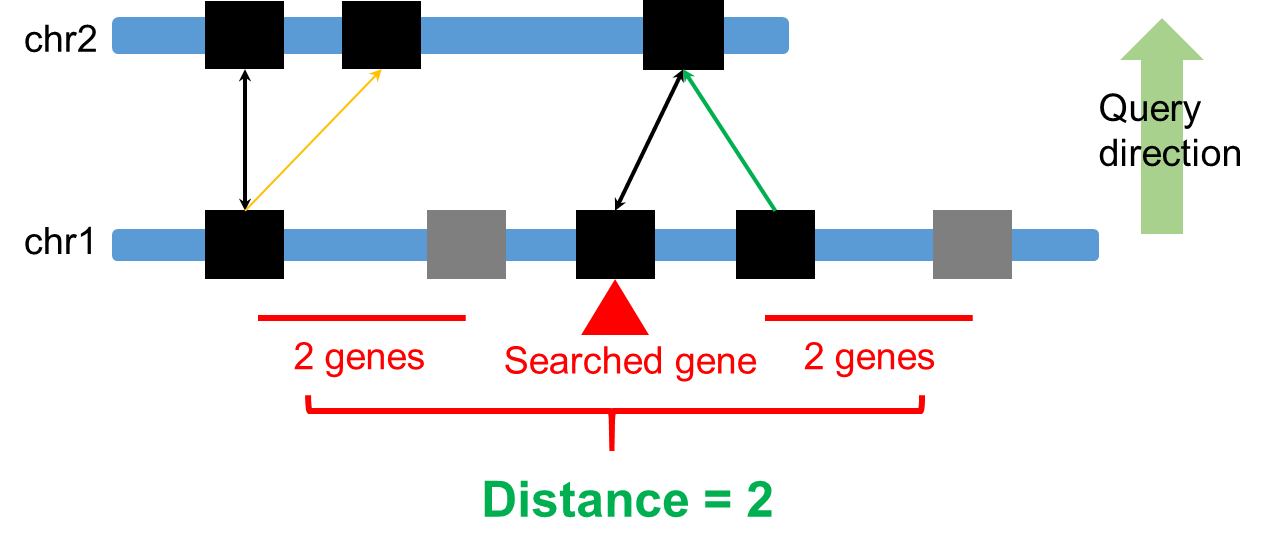
The Distance, which is used to determine total number of genes on the chromosome, refers to the number of flanking genes.
Note
In addition, TGT provides various functions for visualization, saving format (PDF, PNG and CSV formats), and Links to external databases.
All tools have option numbers to indicate the order of input, such as 1,2, and 3.1.
Layouts of all modules are divided into two parts: the input area and the output area.
Only the longest transcripts that represent the genes are used and showed.
Users can click on the example buttom to enter the default data to quickly start.