TGT provides a comprehensive analysis of GO for users, including single sample GO analysis, multiple samples GO analysis, orthologues-based GO analysis, and various visualization functions.
Single Sample GO Enrichment Analysis
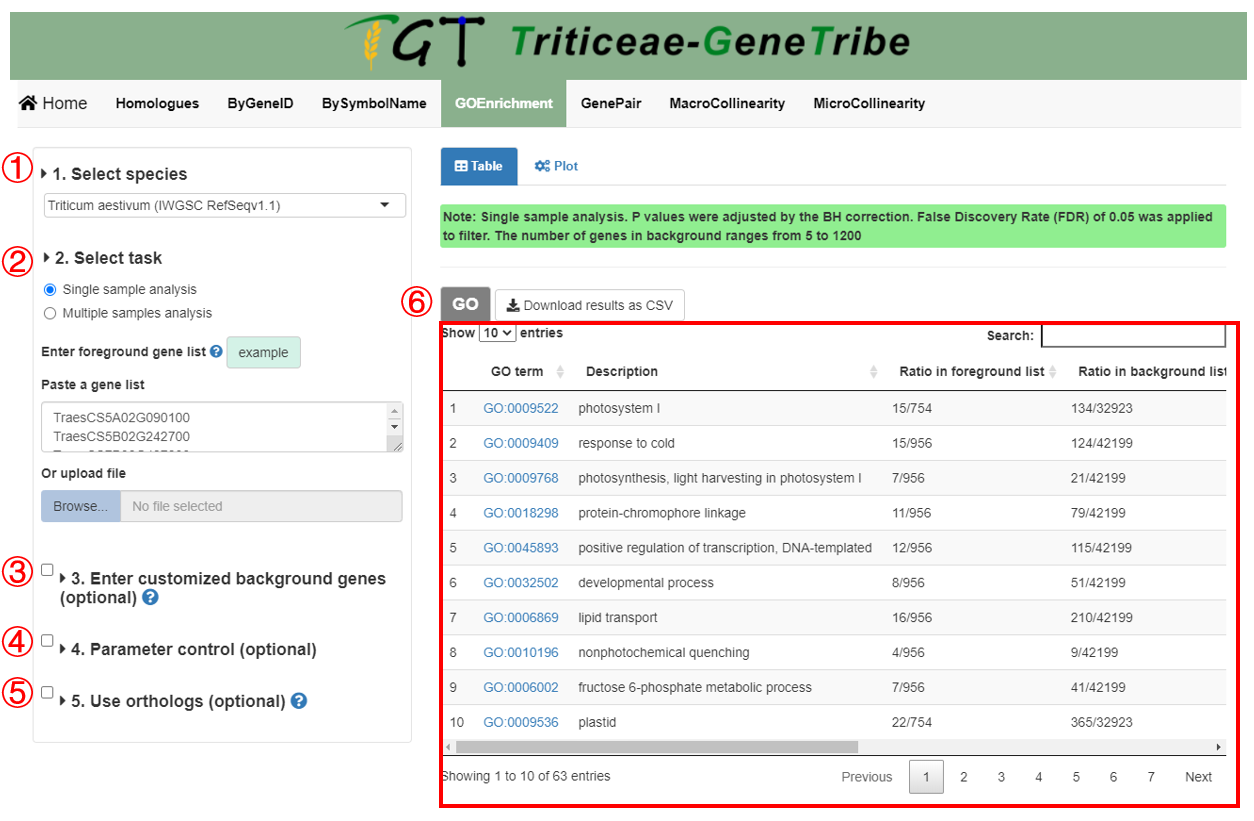
Step 1. You should select an assembly from the drop-down menu.
Step 2. Then you should enter the foreground gene, such as differential expressed genes (DEGs). We provide two input methods, which are directly pasting a gene list separated by separator, and uploading a TEXT file (one gene ID in each line).
Step 3. (optional) You can upload a TEXT file (newline splited) containing the background gene list, such as all expressed genes (all genes are used by default).
Step 4. (optional) You can set some parameters to filter low-confidence GO term.
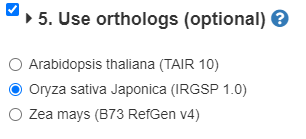
Step 5. (optional) You can perform the ortholog-based GO Enrichment Analysis (see the detailed explanation in bottom).
Step 6. Now, you can click the GO button to run task, and the result will be displayed on the right.
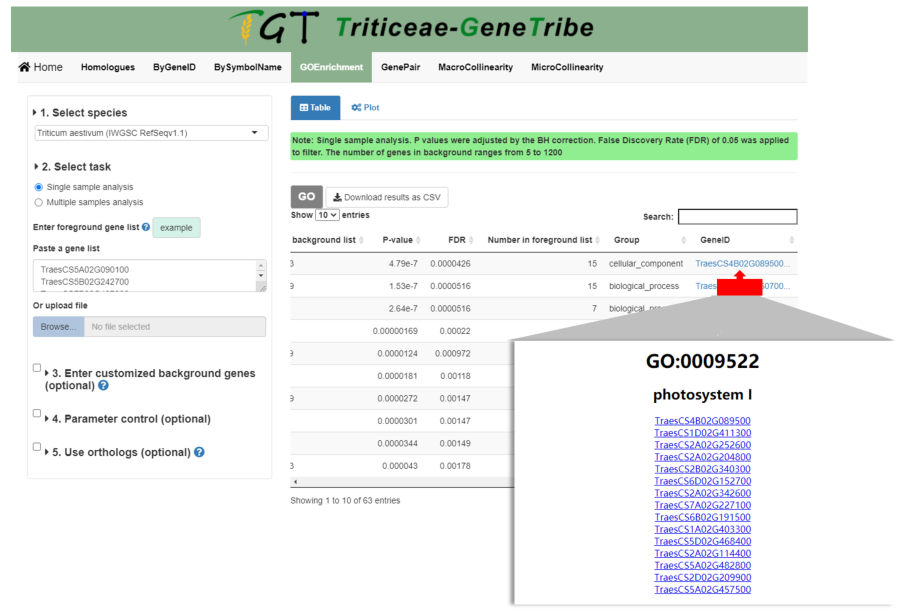
Output. The output result includes GO term, description, gene ratio in foreground gene list, gene ratio in background gene list, P-value, FDR, gene number in foreground gene list, GO group, and genes ID.
As shown below, you can also click the geneID column to view all genes in the GO term, and all genes provide external links.
Plots
After performing GO enrichment analysis, TGT provides various visualization tools for users.
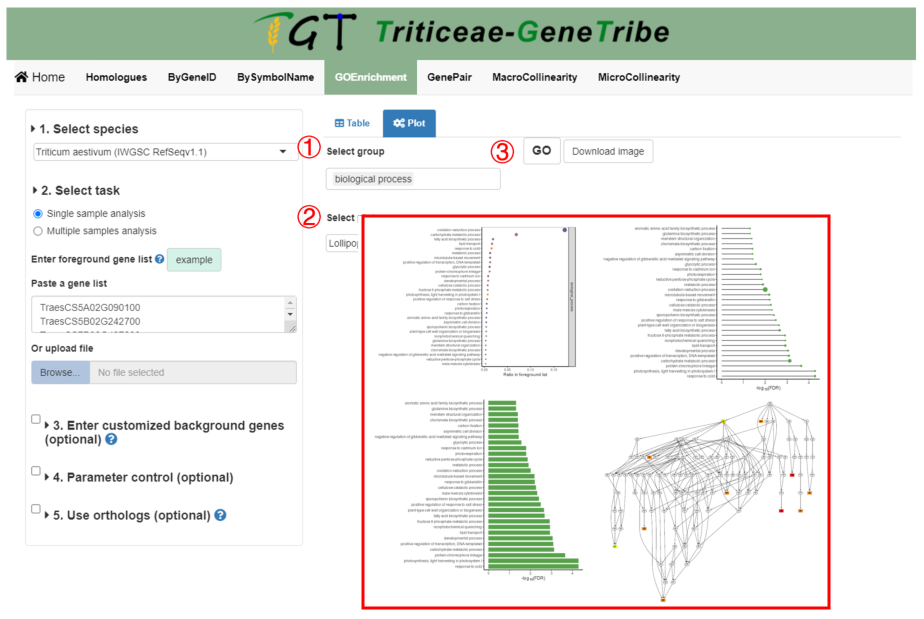
Step 1. You should select the GO groups from the drop-down menu.
Step 2. Then you can select the plot type, including bubble, bar, lollipop, and the GO group network.
Step 3. Now, you can click the GO button to run task, and the result will be displayed on the right.
Output. The GO terms are grouped by GO group and sorted by -log10(FDR) or ratio. Other information has been explained in the legend.
Multiple Samples GO Enrichment Analysis
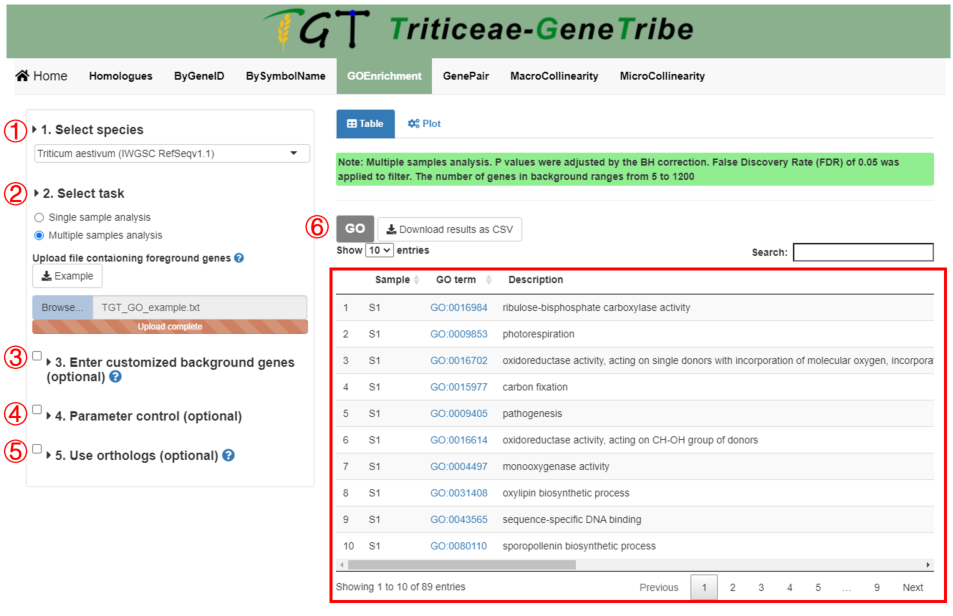
Step 1. You should select an assembly from the drop-down menu.
Step 2. Then you should enter the foreground gene, such as differential expressed genes (DEGs). The example of input file can be downloaded by clicking the example button. The input file is as follows:
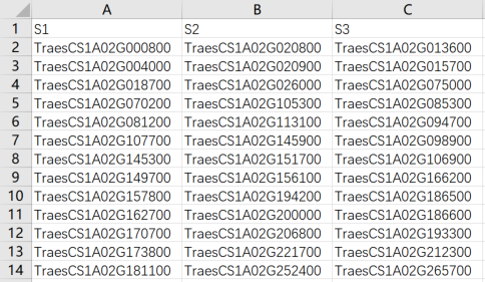
The column corresponds foreground gene lists of samples (such as differential expressed genes (DEGs), ChIP-seq results, etc.). The first row is the group name for visualization.
Step 3. (optional) You can upload a TEXT file (newline splited) containing the background gene list, such as all expressed genes (all annotation genes are used by default).
Step 4. (optional) You can set some parameters to filter low-confidence GO term.
Step 5. (optional) You can perform the ortholog-based GO Enrichment Analysis (see the detailed explanation in bottom).
Step 6. Now, you can click the GO button to run task, and the result will be displayed on the right.
Output. The output result includes sample name, GO term, description, gene ratio in foreground gene list, gene ratio in background gene list, P-value, FDR, gene number in foreground gene list, GO group, and genes ID.
Plots
TGT also provides a customized heat map.
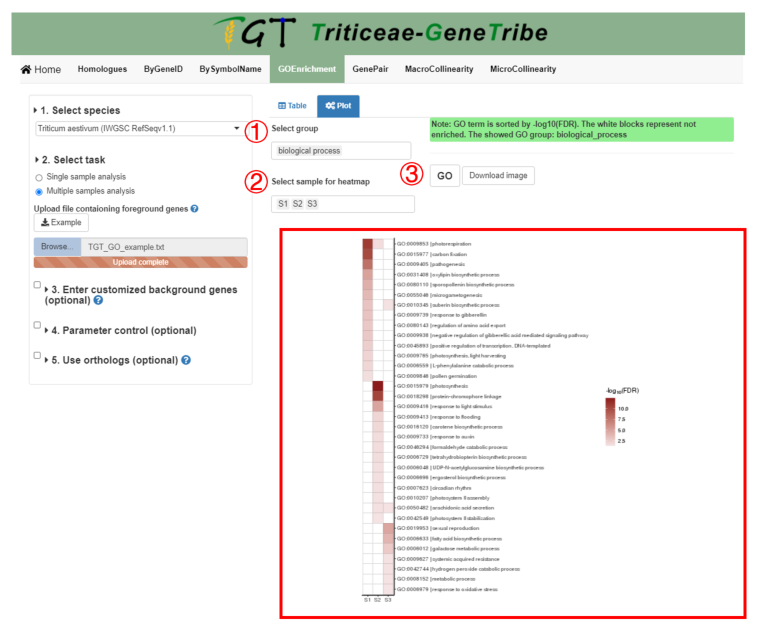
Step 1. You should select the GO groups from the drop-down menu.
Step 2. Then you can select the samples to show.
Step 3. Now, you can click the GO button to run task, and the result will be displayed on the right.
Output. Each column represents a sample, and each row represents a GO term. The darker the color of the block, the more significant the enrichment result. The GO terms are sorted by -log10(FDR). If the result is not enriched, the color is white.
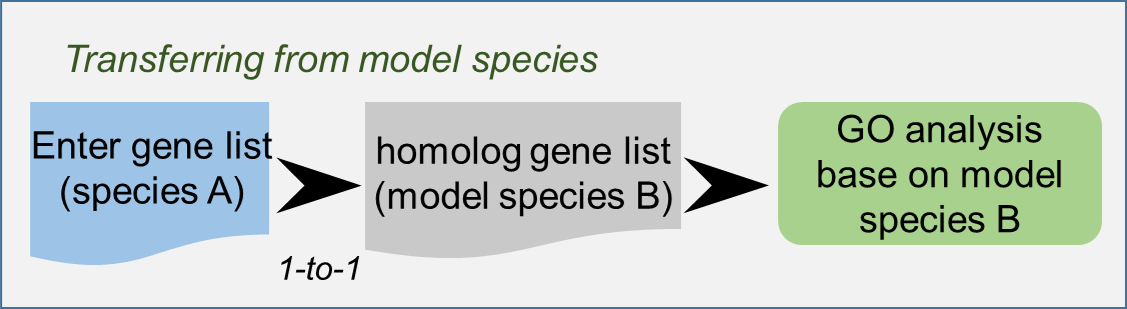
Ortholog-based GO Enrichment Analysis
Using this tool, you can perform the ortholog-based GO enrichment analysis. It uses the orthologues of foreground genes. The general process is as follows: