In this tool, you can view homologous relationships of genes among genomes, construct phylogenetic tree, visualize gene structure, perform the Multiple Sequence Alignment analysis, and view location of homologous genes in the genome.
Query 1-to-1 Homologous Gene
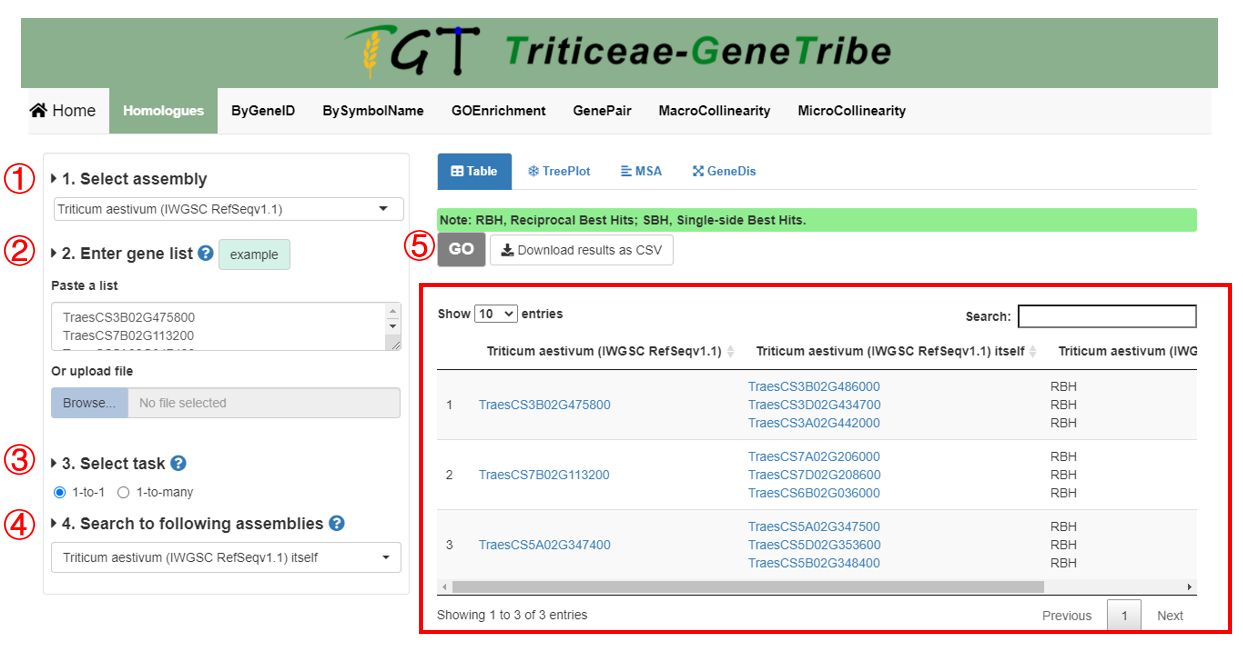
Step 1. You should select an assembly from the drop-down menu.
Step 2. Then you can enter gene list. We provide two input methods, which are directly pasting a gene list separated by separator, or uploading a TEXT file (newline splited).
Step 3. TGT supports two data type. if 1-to-1, TGT will provide you RBH (Reciprocal Best Hit) and SBH (Single-side Best Hit) gene pairs.
Step 4. You can choose multiple assemblies.
Step 5. Now, you can click the GO button to run task, and the result will be displayed on the right immediately.
Output. The output result contains the homologous gene IDs and homologous types (i.e. RBH and SBH). If the queried assembly is from polyploid, each subgenome will be queried once.
Query 1-to-many Homologous Gene
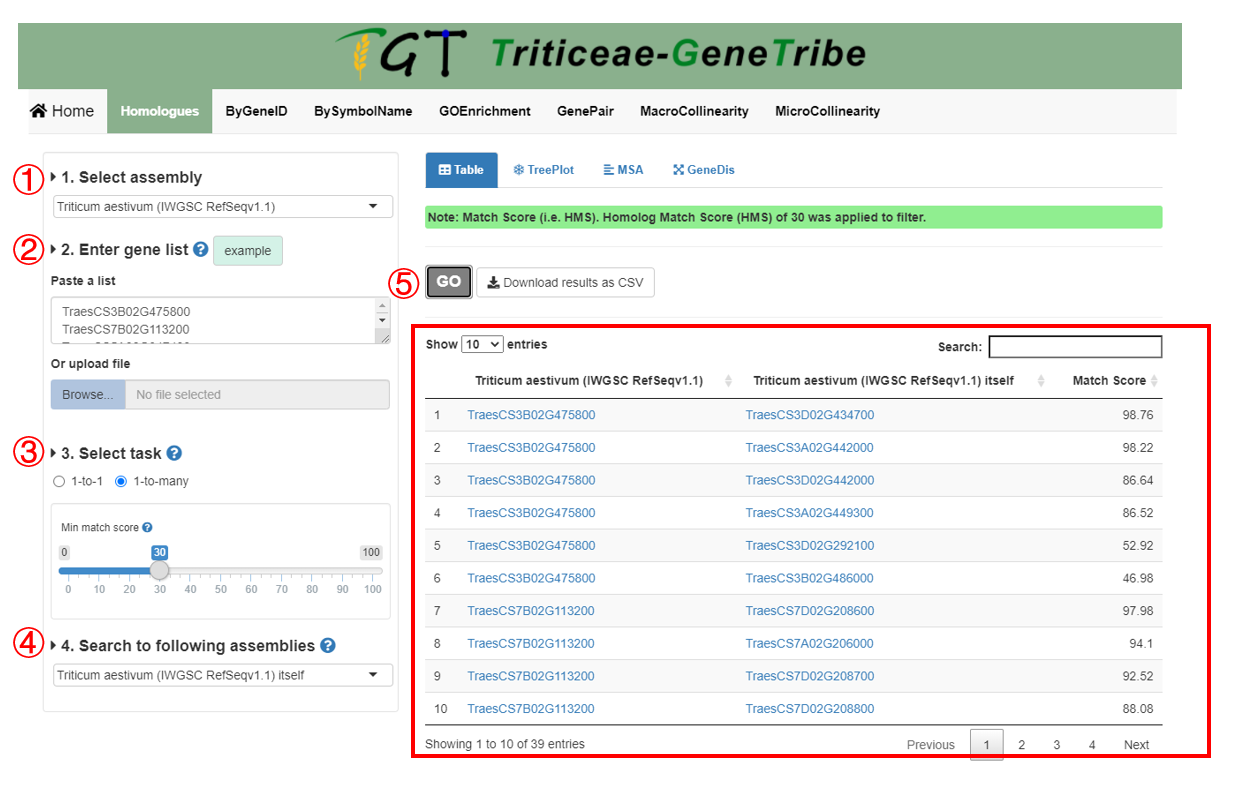
Step 1. You should select an assembly from the drop-down menu.
Step 2. Then you can enter gene list. We provide two input methods, which are directly pasting a gene list separated by separator, and uploading a TEXT file (newline splited).
Step 3. TGT supports two data type. If 1-to-many, TGT will provide you all putative homologous genes that are scored. In addition, you can set threshold to filter the output results.
Step 4. You can choose multiple assemblies to query.
Step 5. Now, you can click the GO button to run task, and the result will be displayed on the right immediately.
Output. The output result contains the homologous gene ID and the homolog match score (HMS). If the queried assembly is polyploid, each subgenome will be queried once.
Note:
If the homologous gene query has been analyzed before using the remaining three tools, the result of the homologous gene query will also be used as inputs of three tools, otherwise only genes in input box of the step 2.
Build Phylogenetic Tree and Visualize Gene Structure
 All gene structures are extracted from GFF files. MSA is performed by software MAFFT.
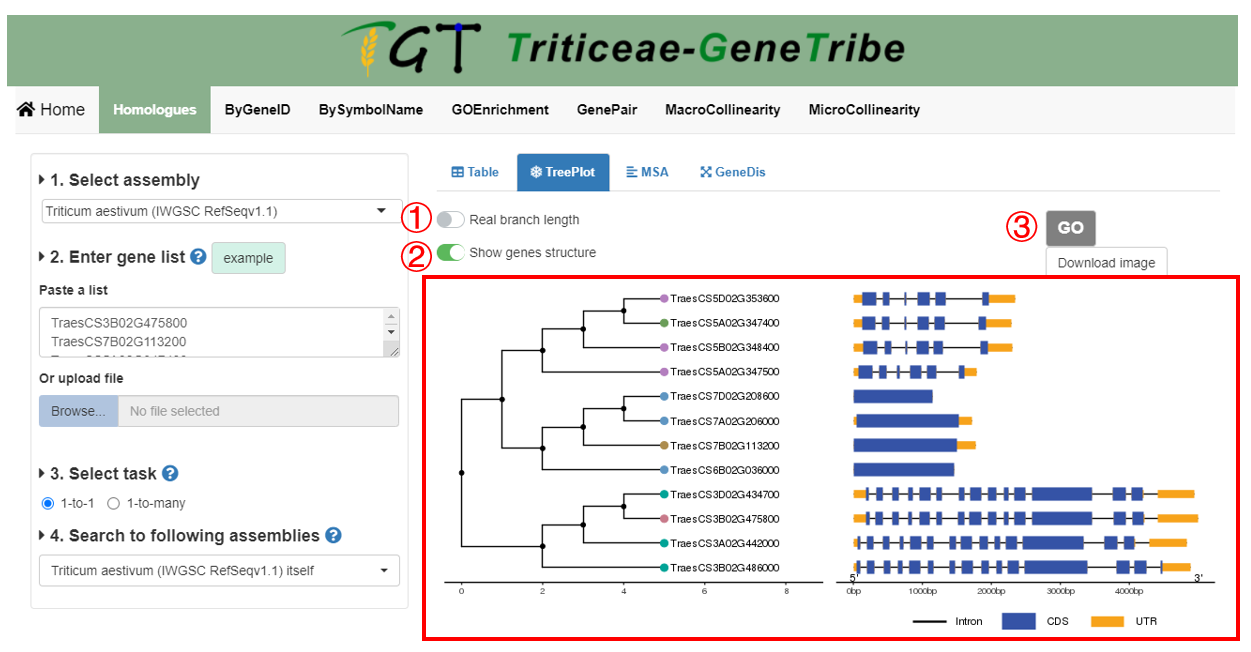
Step 1. You can choose to display the true branch length, which is useful for the clearer visualization.
Step 2. Exons, intron, and UTR will be showed when you choose to show genes structure, otherwise, two options will appear on the right, including the Tree Type, which is used to set drawing style, and the Tree Root ID, which is set root gene of tree.
Step 3. Now, you can click the GO button to run task, and the result will be displayed on the right.
Output. The output result contains tree and gene structure. The node colors of the tree are grouped by homologous gene sources, and only the longest transcripts are used to show.
Show Multiple Sequence Alignment (MSA) Result
 This function is performed by msaR.
Step 1. You must run the tree before performing MSA. You can click download button to download FASTA file containing protein sequence of longest transcript.
Step 2. Then you can click the View button to view the result of Multiple Sequence Alignment, a window will pop up, as shown by the gray box below the button.
Step 3. You can drag the scroll bar to view MSA, and you can also upload customized data, find motif, change color scheme etc.
Show Location of Genes in Genome
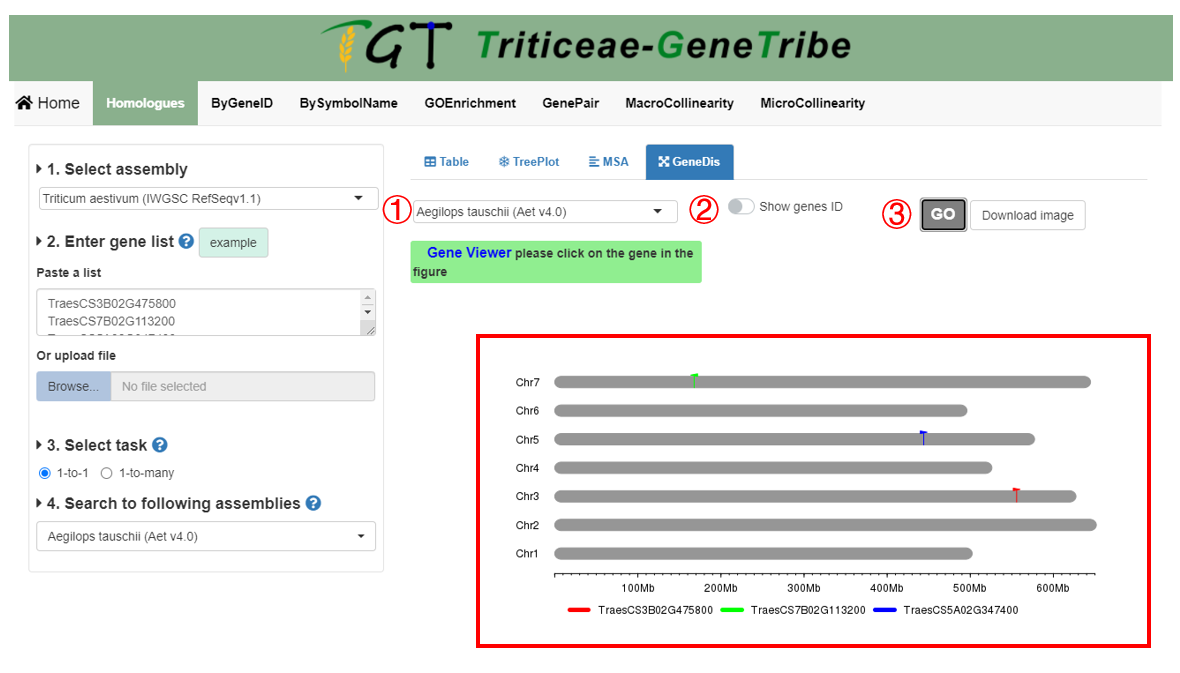
Step 1. You should select an assembly.
Step 2. You can freely choose whether to display gene IDs.
Step 3. You can click the GO button to run this tool, and the result will be displayed on the right.
Output. In output results, each gray bar represents a chromosome, gene colors are grouped by homologous gene sources, the horizontal scale indicates the size of the chromosomes.