TGT can show gene collinearity in micro-region among multiple species.

Step 1. You should select an assembly from the drop-down menu.
Step 2. Then you should select another assembly from the drop-down menu.
Step 3. You should input a gene and set the Distance.
Step 4. You can also input chromosome region (chromosome:start-end) that you want to mark. Priority: Step 4 > Step 3.
Step 5. We provide powerful customized visualization options, which are described as follows:
One-to-many. All homologous genes will be showed, otherwise, only 1-to-1 (i.e. RBH and SBH).
Gene spacing. Genes spacing will be showed.
Gene ID. Gene ID will be showed on the genes.
LC gene. The low-confidence (LC) genes will be showed on the chromosomes.
Distinguish scores. Scores will be grouped by different line type.
Real spacing. The real spacing between two genes, otherwise, the scaled internal by rank will be showed.
Gene Length. Gene length will be showed on genes.
Step 6. You can click the GO button to run task, and the result will be displayed in the lower area.
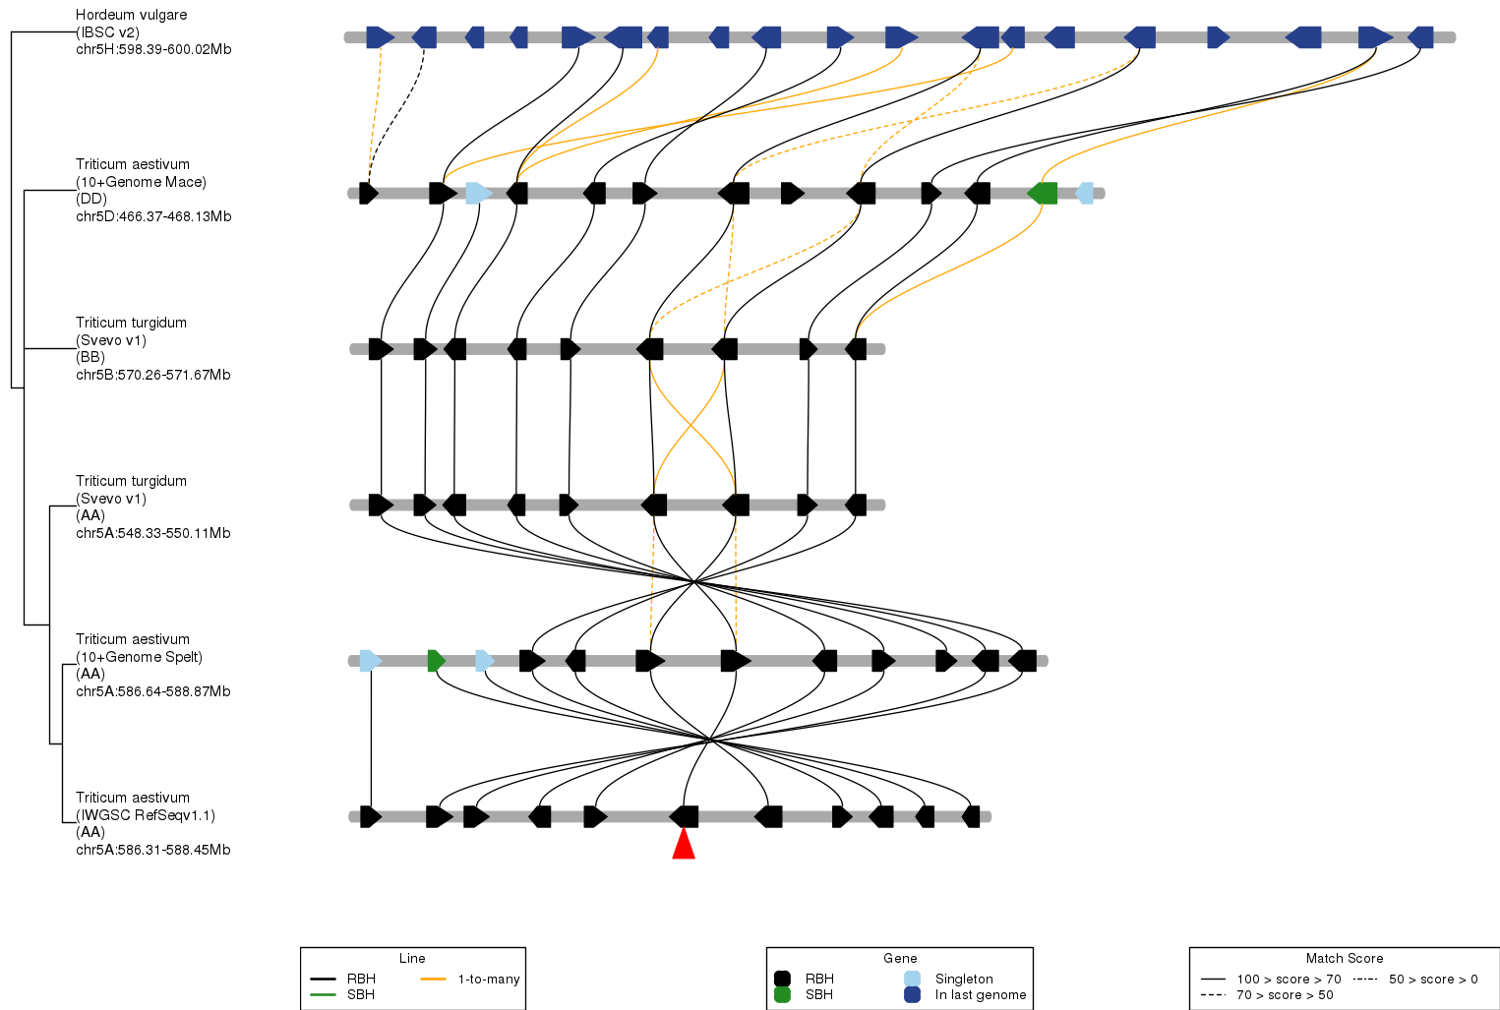
Output. The genes and lines (i.e. homologous gene pairs) are grouped by homologous relationships (i.e. RBH, SBH, singleton, and 1-to-many). Color priority: RBH > SBH > 1-to-many. All homologous lines are grouped as three groups by score, which are 0-50, 50-70, and 70-100. The input gene is marked by red triangle. Only the genomes that have collinear block will be showed. You should trace evolutionary hsitory of genes from bottom to top.
The left tree is obtained from a pre-computed relationship derived from GeneTribe.
Note: All genes can be clicked to show IDs and links to external expression database.