TGT can show the optimal homologous gene pair between species.
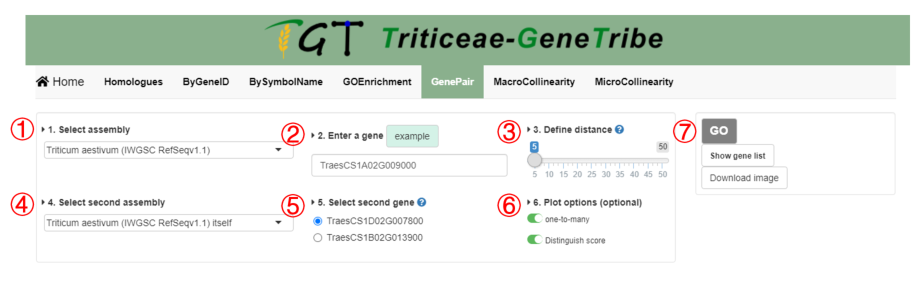
Step 1. You should select an assembly from the drop-down menu.
Step 2. Then you can input a gene you need to analysis.
Step 3. You should define a distance (i.e. the number of flanking genes). For detailed instructions, please refers to Definition of the Distance in collinearity plot in the General page.
Step 4. You should choose another genome for comparing with the first assembly.
Step 5. Now, you can see that multiple gene IDs corresponding to subgenomes are showed, you should select a gene ID to determine the subgenome that will be queried.
Step 6. This option controls layout of visualization, if you choose one-to-many, all homologous genes will be showed, otherwise, only a gene pair (i.e. RBH and SBH). If you choose to distinguish scores, scores will be grouped by line type.
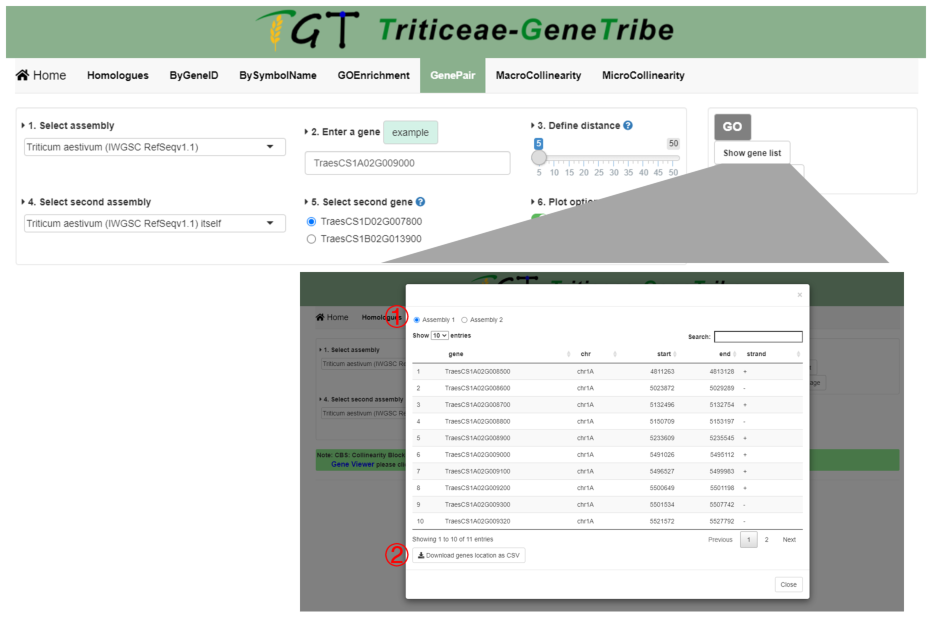
Step 7. You can click the GO button to run task, and the result will be displayed on the right. You can click the Show Gene List button to view location of genes in figure. The output result includes gene ID, chromosome, start location, end location, and strand.
Output.
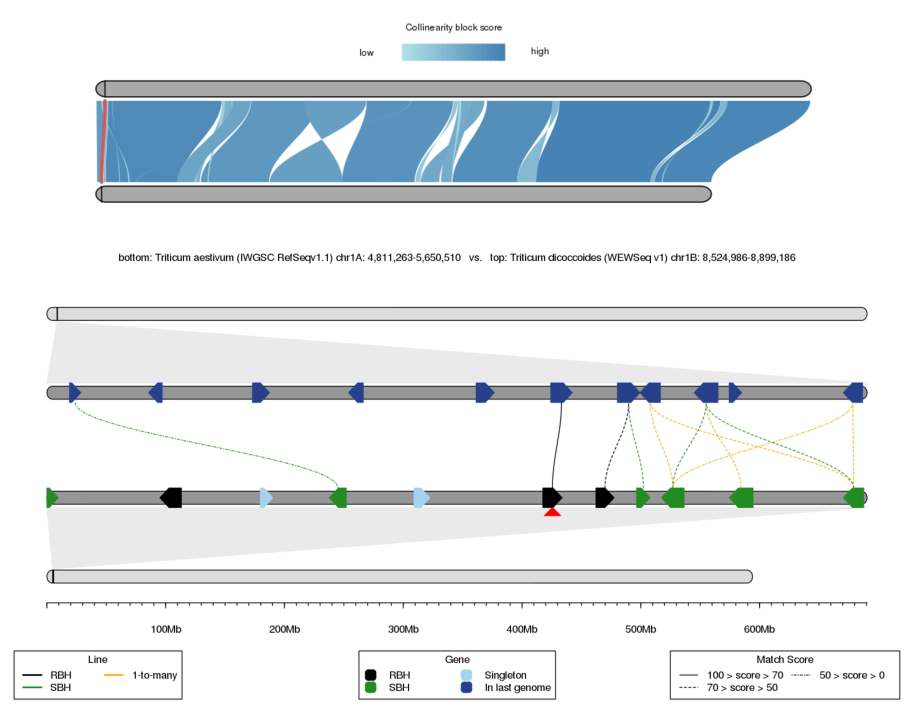
The output result contains two parts, which are the upper chromosome collinearity and the lower local collinearity.
The colors of collinear block are grouped by CBS (Collinear Block Score). The higher the CBS, the better the collinearity. The lower chromosome corresponds to the first genome, and the upper chromosome corresponds to the second genome. The inputted gene is marked by red triangle.
In the local collinearity, the genes and lines (i.e. homologous gene pairs) on the first chromosome region are grouped by homologous relationships (i.e. RBH, SBH, singleton, and 1-to-many). Color priority: RBH > SBH > 1-to-many. All homologous lines are grouped as three groups by score, which are 0-50, 50-70, and 70-100.