In this tool, TGT can show chromosome collinearity between subgenomes.
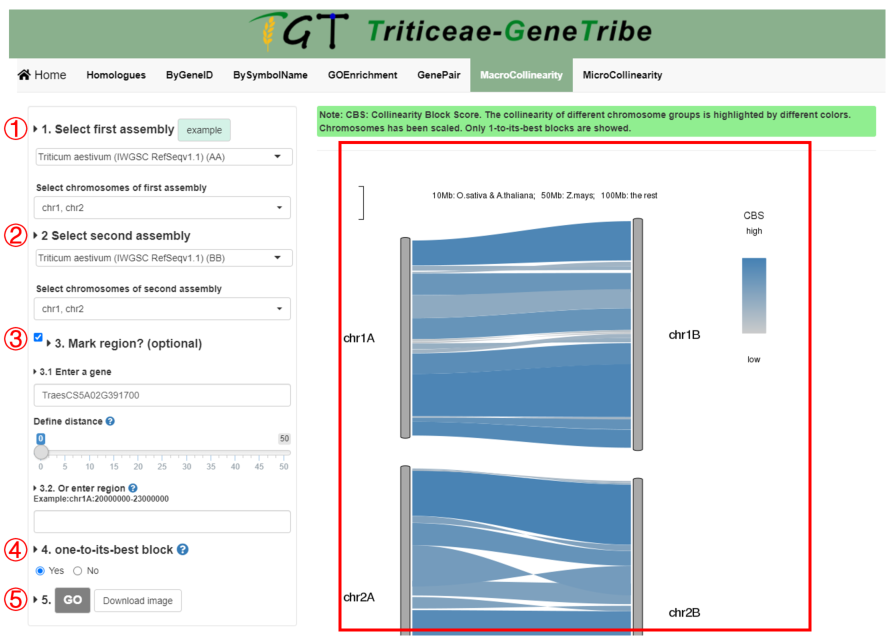
Step 1. You should select the first assembly and chromosomes from the drop-down menu.
Step 2. Then you should select the second assembly and chromosomes from the drop-down menu.
Step 3. (Optional) If you want to mark the region you are interested in in the image, you should input a gene and set the Distance, or input chromosome region (chromosome:start-end). Priority: region > gene.
Step 4. You can only view the best collinear blocks. Blocks of different chromosomes are grouped by color.
Step 5. You can click the GO button to run task, and the result will be displayed on the right.
Output. The colors of block are grouped by CBS (Collinear Block Score). The higher the CBS, the better the collinearity. The left chromosome corresponds to the first genome and the right chromosome corresponds to the second genome. The region containing inputted gene is colored as black. The length of the chromosome has been scaled and the scale is shown on the top.